Tutorial
[1]:
import numpy as np
import matplotlib.pyplot as plt
from IPython.display import display
import pymwm
plt.style.use('seaborn-notebook')
plot_params = {
    'figure.dpi': 96,
    'axes.labelsize': 'xx-large',
    'xtick.labelsize': 'x-large',
    'ytick.labelsize': 'x-large',
    'legend.fontsize': 'large',
    'savefig.bbox': 'tight',
    'savefig.pad_inches': 0.03,
}
plt.rcParams.update(plot_params)
[2]:
wl_max = 1.0
wl_min = 0.5
water = {'RI': 1.333}
params = {'core': {'shape': 'cylinder', 'size': 0.15,
'fill': water},
'clad': {'book': 'Au', 'page': 'Stewart-DLF'},
'bounds': {'wl_max': wl_max, 'wl_min': wl_min, 'wl_imag': 10.0},
'modes': {'num_n': 6, 'num_m': 2}}
wg1 = pymwm.create(params)
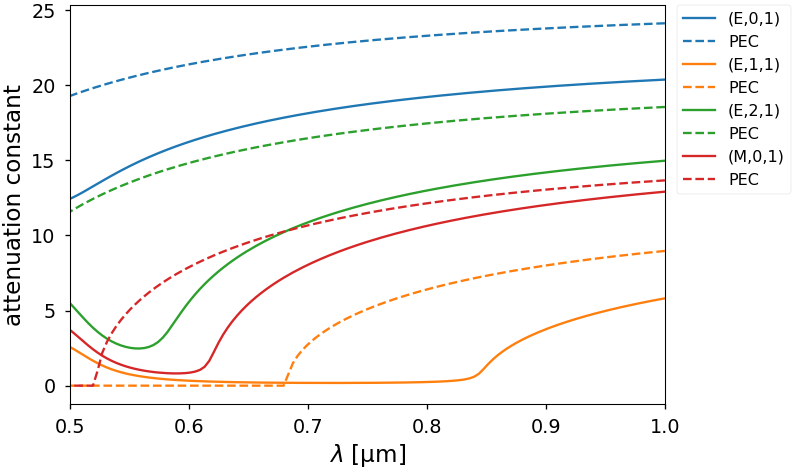
wg1.plot_beta(('E', 0, 1), "-", wl_max=wl_max, wl_min=wl_min, comp='real')
wg1.plot_beta(('E', 1, 1), "-", wl_max=wl_max, wl_min=wl_min, comp='real')
wg1.plot_beta(('E', 2, 1), "-", wl_max=wl_max, wl_min=wl_min, comp='real')
wg1.plot_beta(('M', 0, 1), "-", wl_max=wl_max, wl_min=wl_min, comp='real')
plt.show()
wg1.plot_beta(('E', 0, 1), "-", wl_max=wl_max, wl_min=wl_min, comp='imag')
wg1.plot_beta(('E', 1, 1), "-", wl_max=wl_max, wl_min=wl_min, comp='imag')
wg1.plot_beta(('E', 2, 1), "-", wl_max=wl_max, wl_min=wl_min, comp='imag')
wg1.plot_beta(('M', 0, 1), "-", wl_max=wl_max, wl_min=wl_min, comp='imag')
plt.show()
2022-01-13 15:19:59,109 INFO services.py:1250 -- View the Ray dashboard at http://127.0.0.1:8265

[3]:
wg1.alpha_all
[3]:
[('E', 1, 1),
 ('E', 2, 1),
 ('E', 3, 1),
 ('E', 4, 1),
 ('M', 0, 1),
 ('M', 1, 1),
 ('E', 0, 1),
 ('E', 1, 1),
 ('E', 2, 1),
 ('E', 3, 1),
 ('E', 4, 1),
 ('M', 1, 1)]
[4]:
wl = 0.6
w = 2 * np.pi / wl
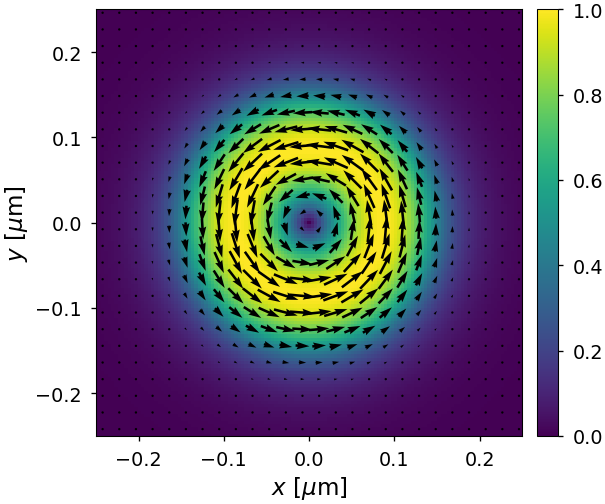
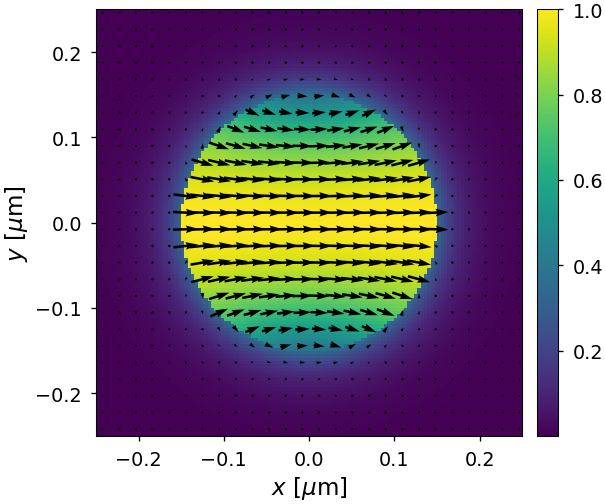
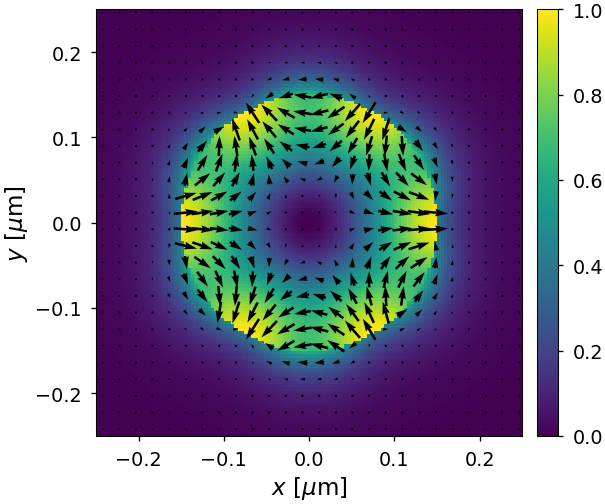
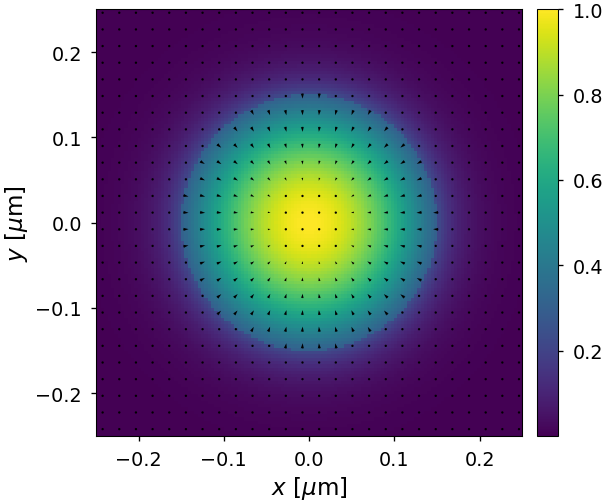
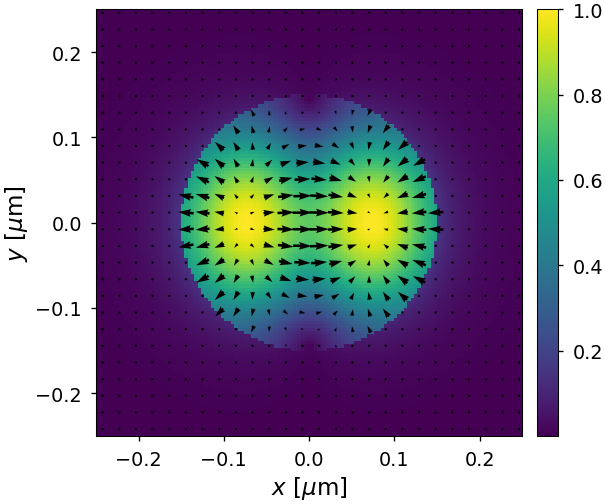
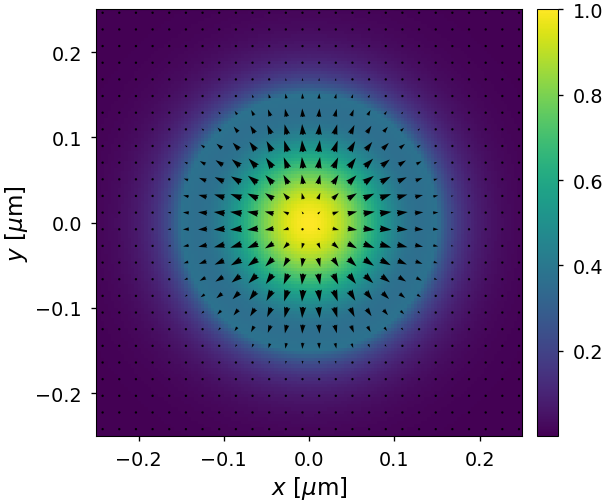
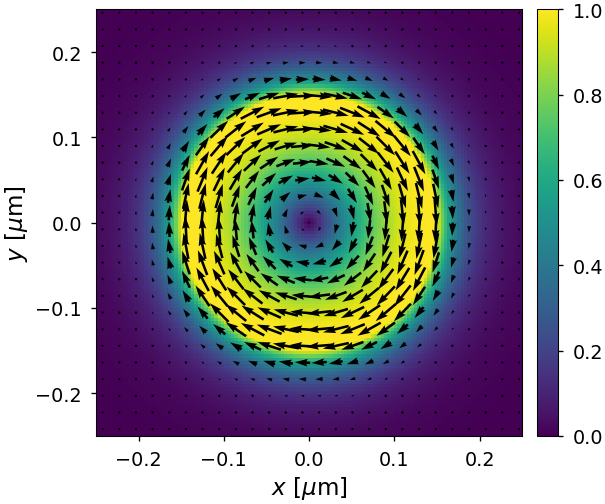
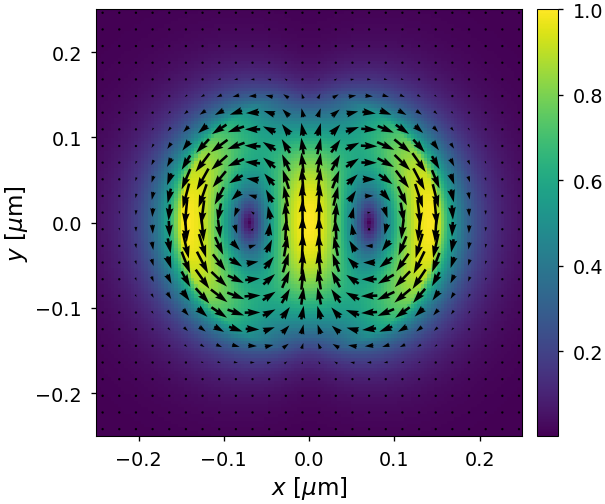
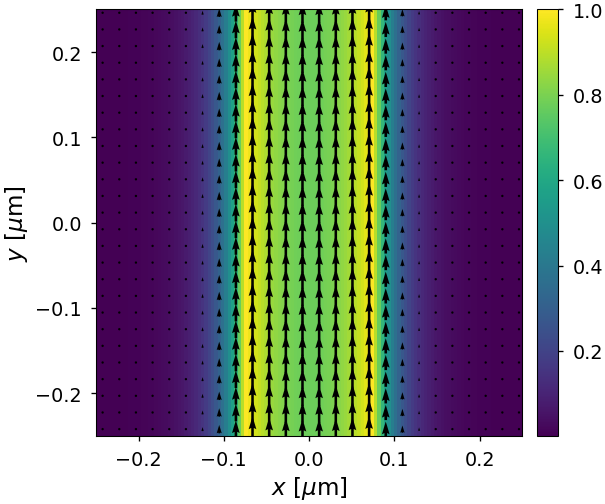
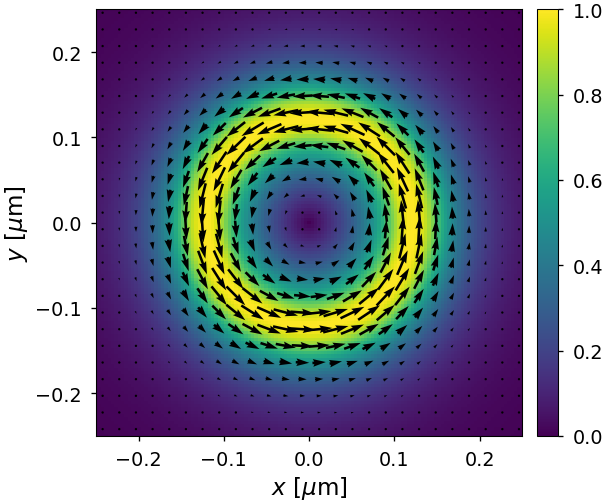
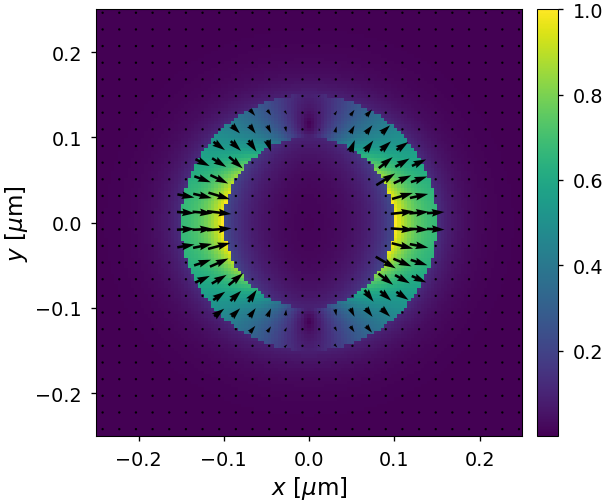
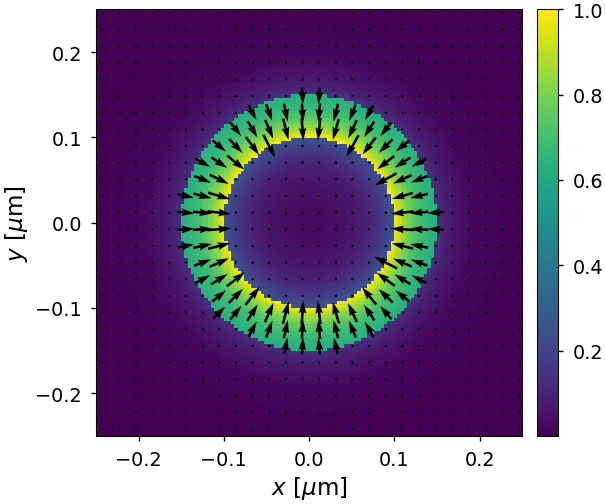
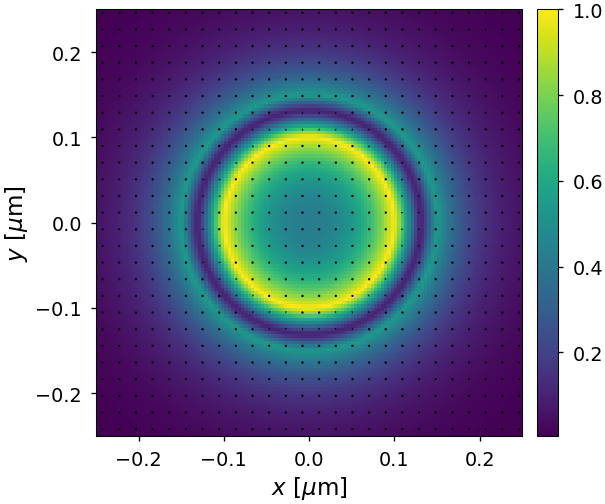
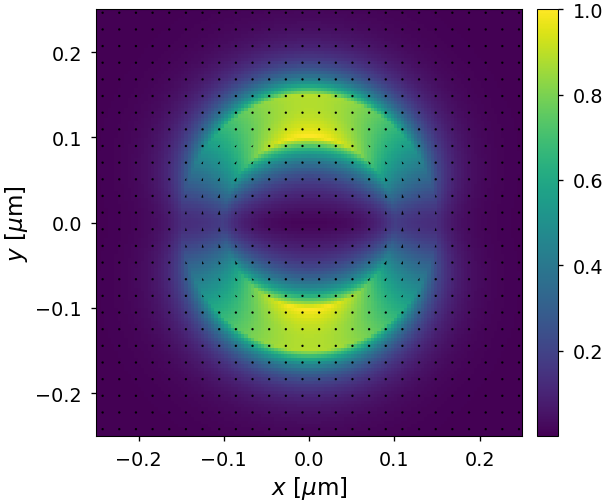
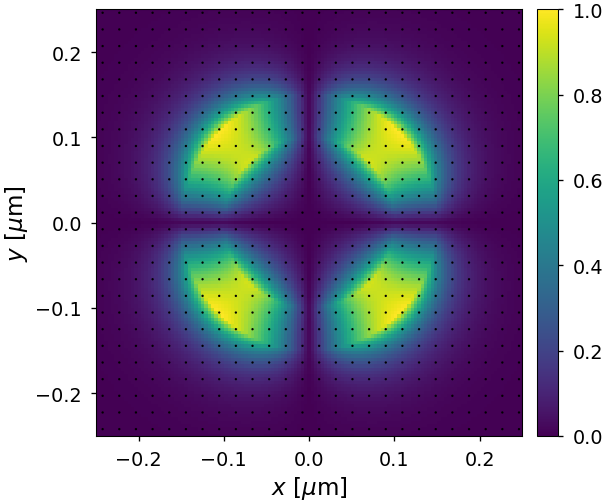
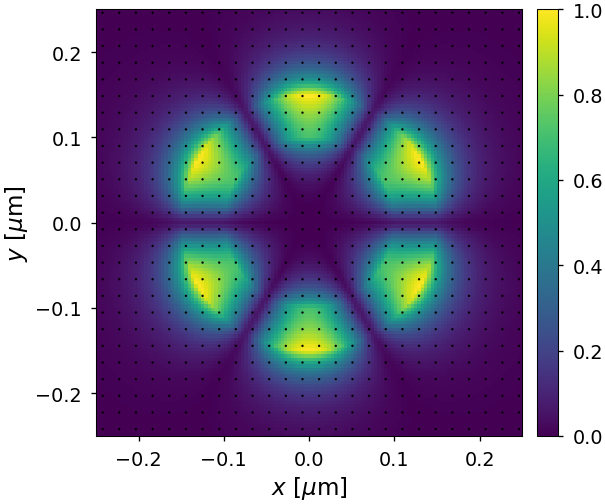
wg1.plot_e_field(w, dir='v', alpha=('E', 0, 1))
wg1.plot_e_field(w, dir='h', alpha=('E', 1, 1))
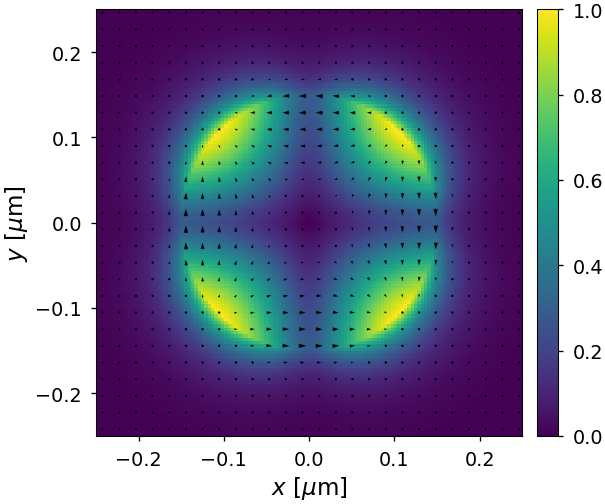
wg1.plot_e_field(w, dir='h', alpha=('E', 2, 1))
wg1.plot_e_field(w, dir='h', alpha=('E', 3, 1))
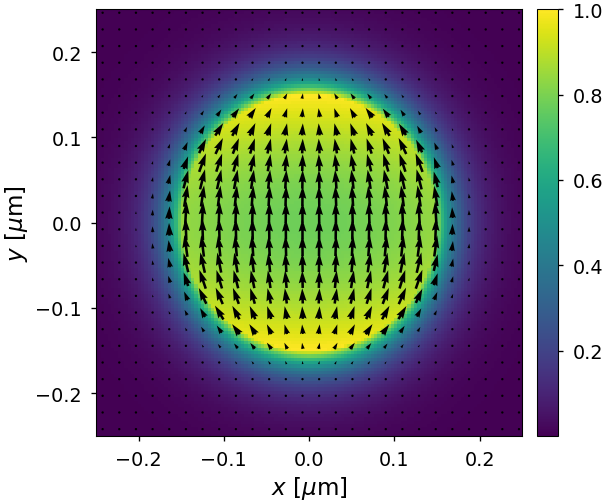
wg1.plot_e_field(w, dir='h', alpha=('M', 0, 1))
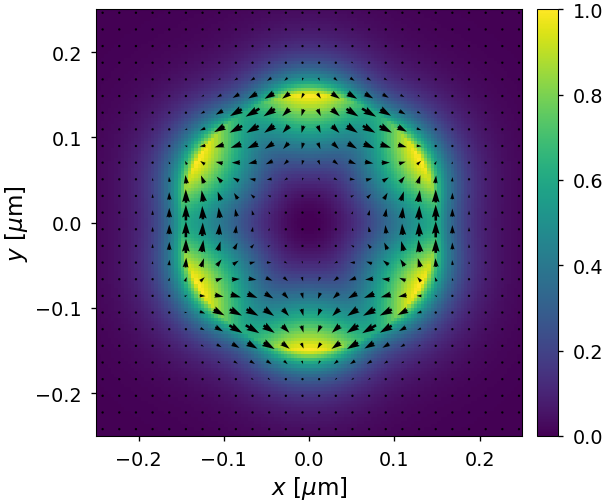
wg1.plot_e_field(w, dir='h', alpha=('M', 1, 1))

[5]:
wl = 0.6
w = 2 * np.pi / wl
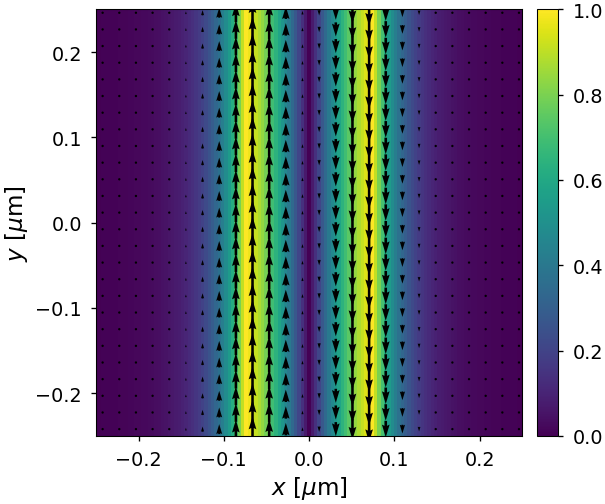
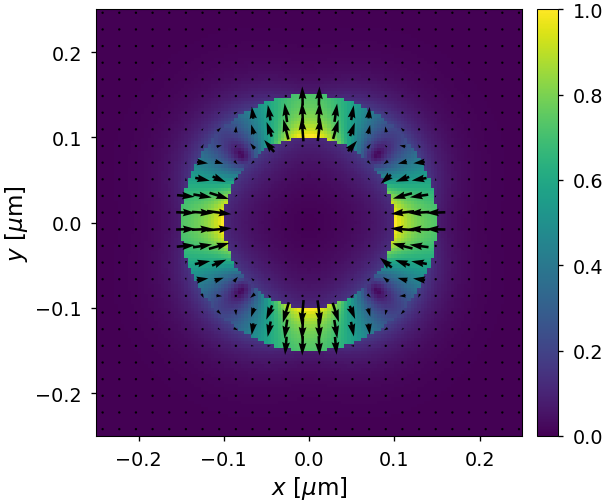
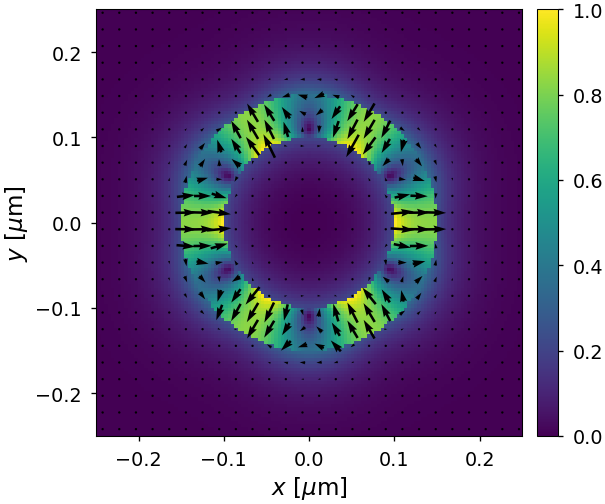
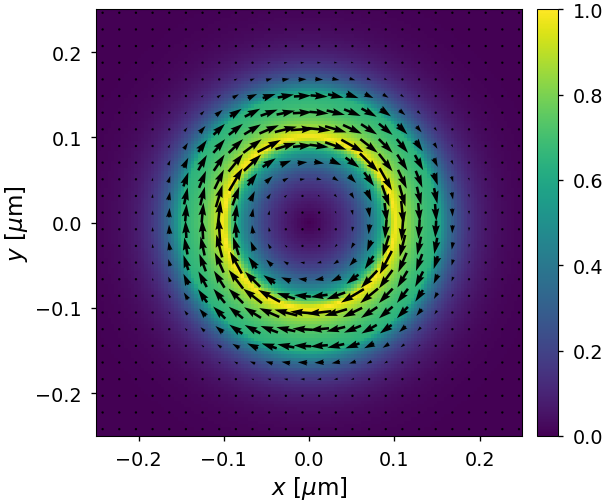
wg1.plot_h_field(w, dir='v', alpha=('E', 0, 1))
wg1.plot_h_field(w, dir='h', alpha=('E', 1, 1))
wg1.plot_h_field(w, dir='h', alpha=('E', 2, 1))
wg1.plot_h_field(w, dir='h', alpha=('E', 3, 1))
wg1.plot_h_field(w, dir='h', alpha=('M', 0, 1))
wg1.plot_h_field(w, dir='h', alpha=('M', 1, 1))
[6]:
wl = 0.6
w = 2 * np.pi / wl
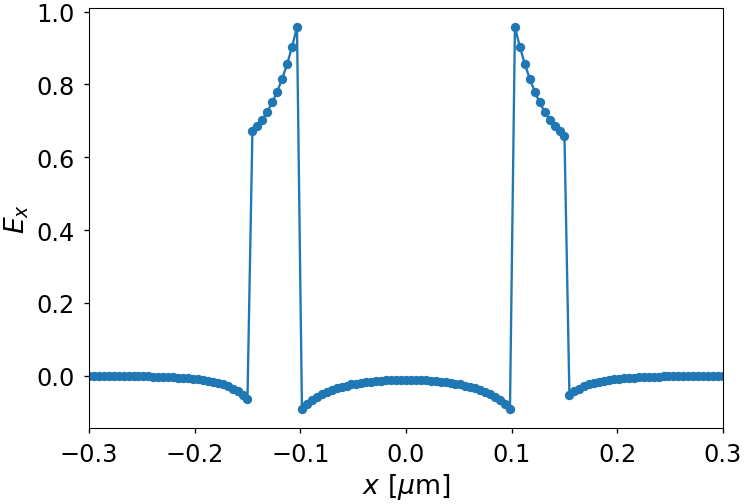
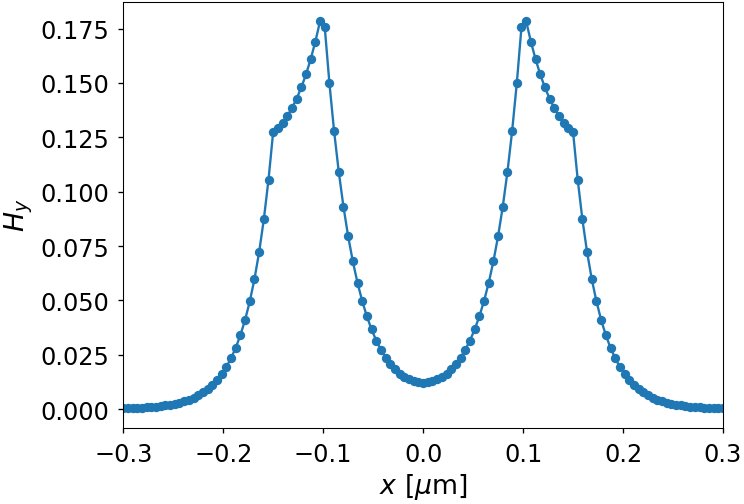
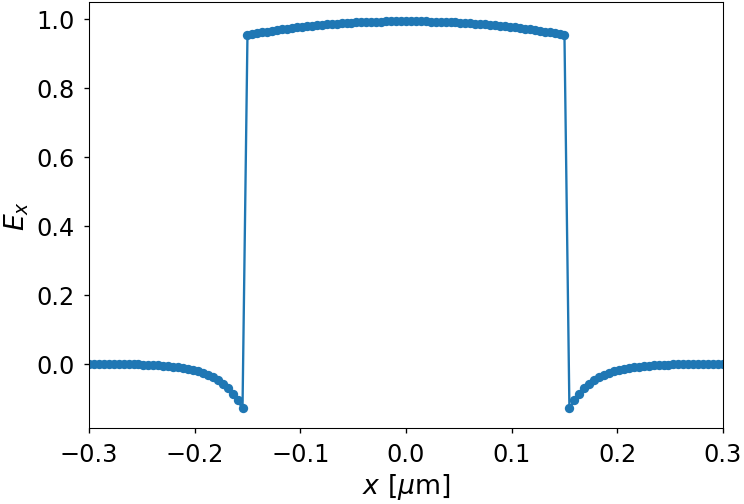
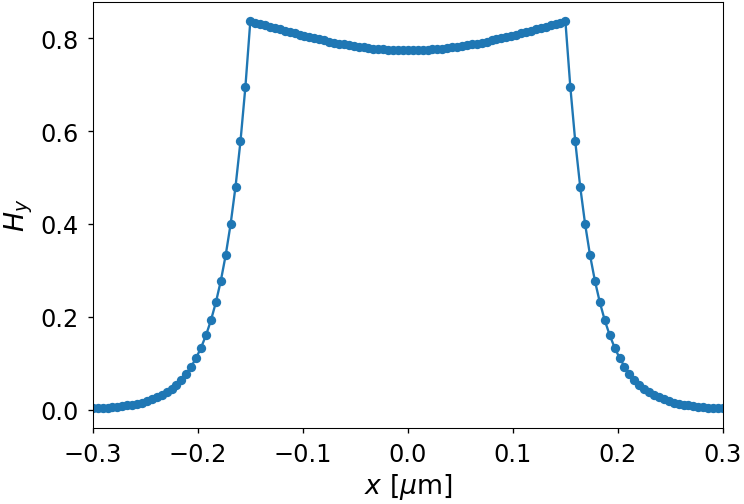
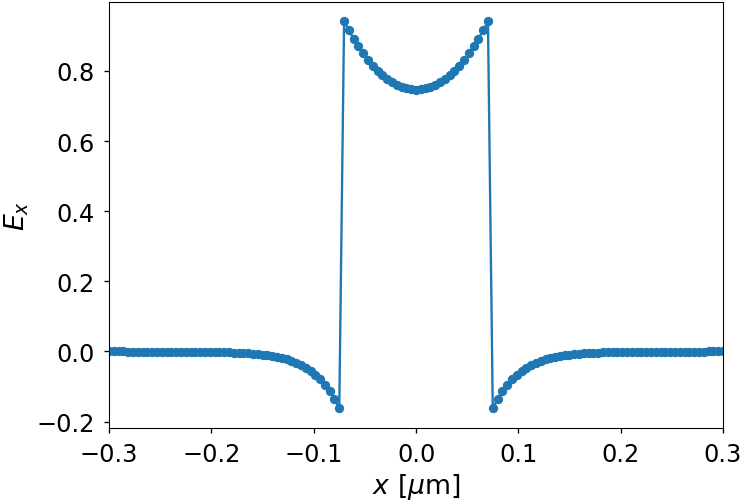
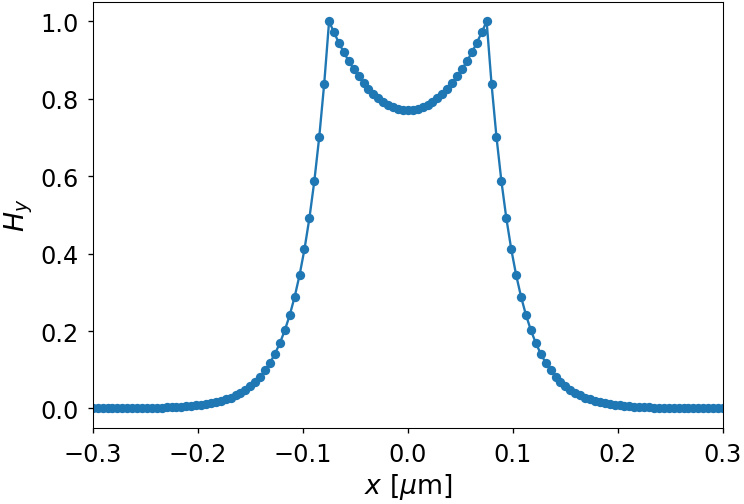
wg1.plot_e_field_on_x_axis(w, dir='h', alpha=('E', 1, 1), comp='x')
wg1.plot_h_field_on_x_axis(w, dir='h', alpha=('E', 1, 1), comp='y')
[7]:
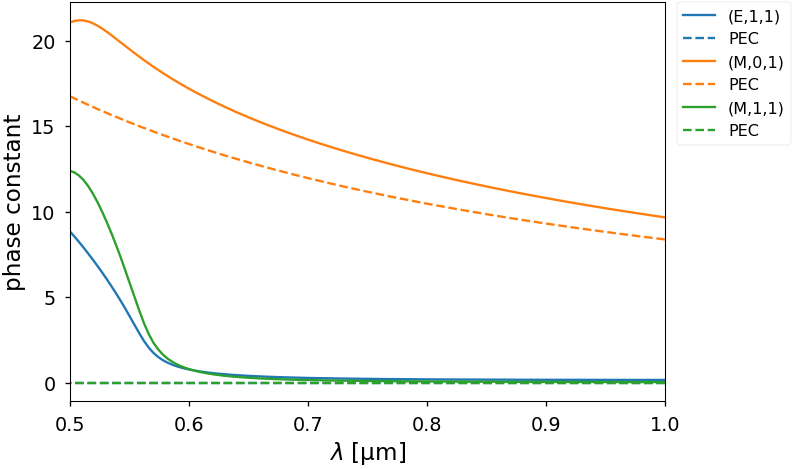
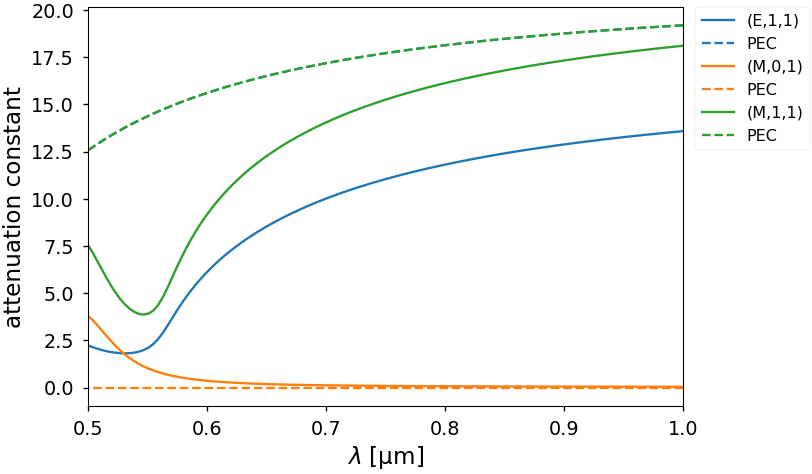
wl_max = 1.0
wl_min = 0.5
water = {'RI': 1.333}
params = {'core': {'shape': 'slit', 'size': 0.15,
                   'fill': water},
          'clad': {'book': 'Au', 'page': 'Stewart-DLF'},
          'bounds': {'wl_max': wl_max, 'wl_min': wl_min,
                     'wl_imag': 10.0},
          'modes': {'num_n': 6}}
wg2 = pymwm.create(params)
wg2.plot_beta(('E', 1, 1), "-", wl_max=wl_max, wl_min=wl_min, comp='real')
wg2.plot_beta(('M', 0, 1), "-", wl_max=wl_max, wl_min=wl_min, comp='real')
wg2.plot_beta(('M', 1, 1), "-", wl_max=wl_max, wl_min=wl_min, comp='real')
plt.show()
wg2.plot_beta(('E', 1, 1), "-", wl_max=wl_max, wl_min=wl_min, comp='imag')
wg2.plot_beta(('M', 0, 1), "-", wl_max=wl_max, wl_min=wl_min, comp='imag')
wg2.plot_beta(('M', 1, 1), "-", wl_max=wl_max, wl_min=wl_min, comp='imag')
plt.show()
2022-01-13 15:22:11,324 INFO services.py:1250 -- View the Ray dashboard at http://127.0.0.1:8265
[8]:
wg2.alpha_all
[8]:
[('M', 0, 1), ('M', 1, 1), ('E', 1, 1)]
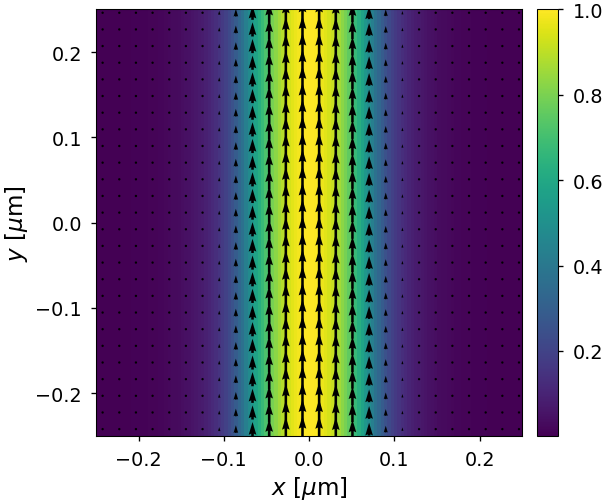
[9]:
wl = 0.6
w = 2 * np.pi / wl
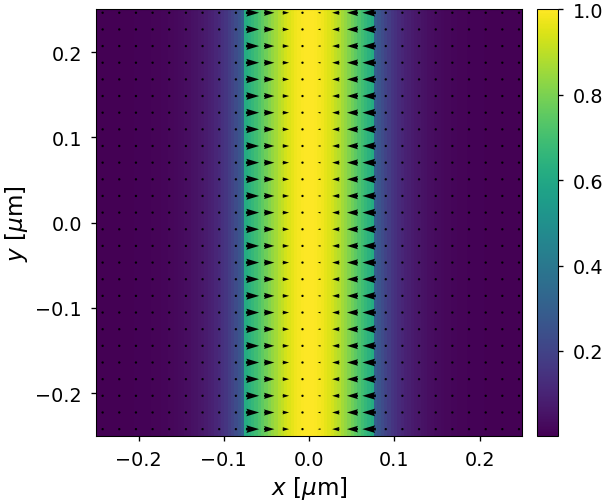
wg2.plot_e_field(w, dir='v', alpha=('E', 1, 1))
wg2.plot_e_field(w, dir='h', alpha=('M', 0, 1))
wg2.plot_e_field(w, dir='h', alpha=('M', 1, 1))
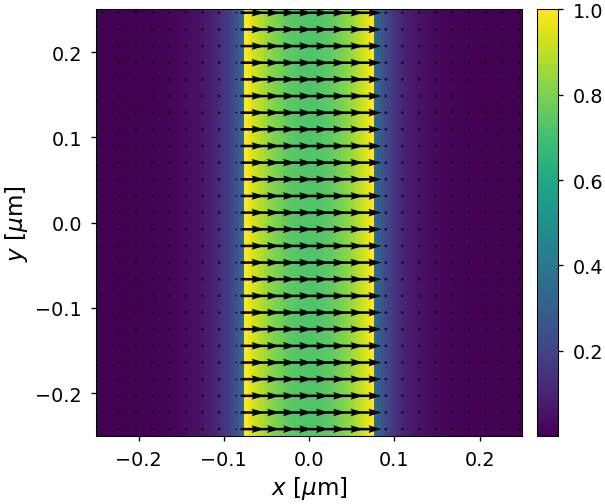
[10]:
wl = 0.6
w = 2 * np.pi / wl
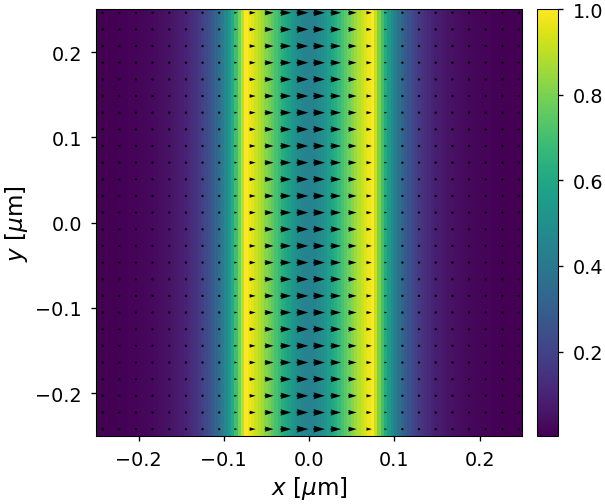
wg2.plot_h_field(w, dir='v', alpha=('E', 1, 1))
wg2.plot_h_field(w, dir='h', alpha=('M', 0, 1))
wg2.plot_h_field(w, dir='h', alpha=('M', 1, 1))
[11]:
wl = 0.6
w = 2 * np.pi / wl
wg2.plot_e_field_on_x_axis(w, dir='h', alpha=('M', 0, 1), comp='x')
wg2.plot_h_field_on_x_axis(w, dir='h', alpha=('M', 0, 1), comp='y')
[12]:
wl_max = 5.0
wl_min = 0.5
params: dict = {
"core": {"shape": "coax", "r": 0.15, "ri": 0.1, "fill": {"RI": 1.0}},
"clad": {"book": "Au", "page": "Stewart-DLF", "bound_check": False},
"bounds": {"wl_max": wl_max, "wl_min": wl_min, "wl_imag": 100.0},
"modes": {"num_n": 6, "num_m": 2},
}
wg1 = pymwm.create(params)
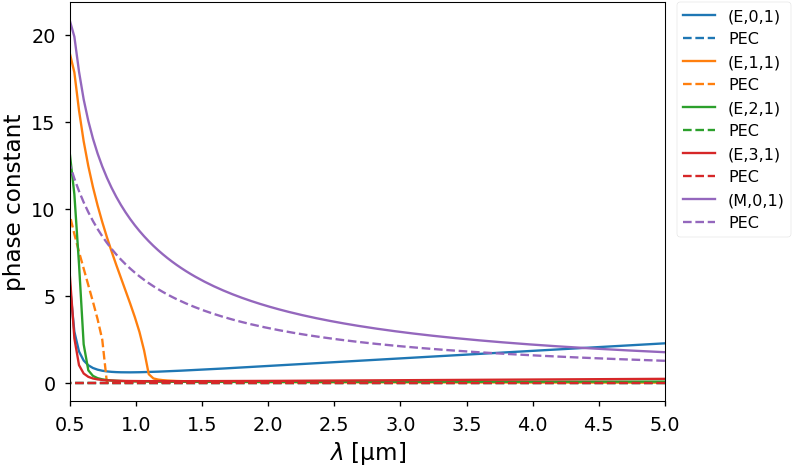
wg1.plot_beta(('E', 0, 1), "-", wl_max=wl_max, wl_min=wl_min, comp='real')
wg1.plot_beta(('E', 1, 1), "-", wl_max=wl_max, wl_min=wl_min, comp='real')
wg1.plot_beta(('E', 2, 1), "-", wl_max=wl_max, wl_min=wl_min, comp='real')
wg1.plot_beta(('E', 3, 1), "-", wl_max=wl_max, wl_min=wl_min, comp='real')
wg1.plot_beta(('M', 0, 1), "-", wl_max=wl_max, wl_min=wl_min, comp='real')
plt.show()
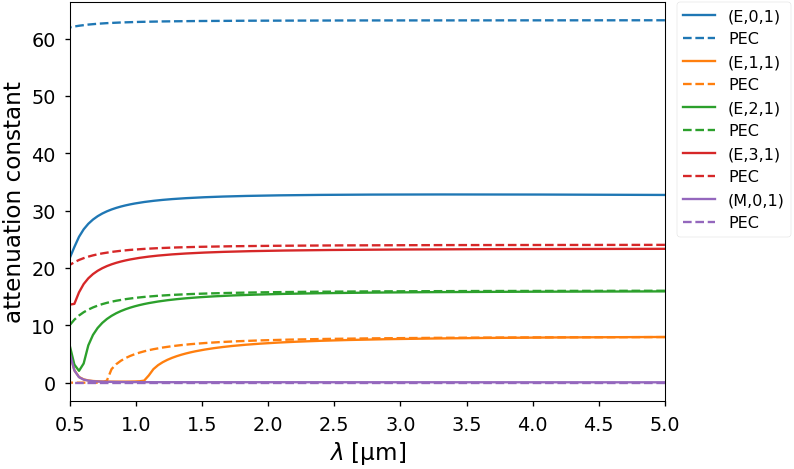
wg1.plot_beta(('E', 0, 1), "-", wl_max=wl_max, wl_min=wl_min, comp='imag')
wg1.plot_beta(('E', 1, 1), "-", wl_max=wl_max, wl_min=wl_min, comp='imag')
wg1.plot_beta(('E', 2, 1), "-", wl_max=wl_max, wl_min=wl_min, comp='imag')
wg1.plot_beta(('E', 3, 1), "-", wl_max=wl_max, wl_min=wl_min, comp='imag')
wg1.plot_beta(('M', 0, 1), "-", wl_max=wl_max, wl_min=wl_min, comp='imag')
plt.show()
2022-01-13 15:22:46,977 INFO services.py:1250 -- View the Ray dashboard at http://127.0.0.1:8265
[13]:
wl = 0.6
w = 2 * np.pi / wl
wg1.plot_e_field(w, dir='v', alpha=('E', 0, 1))
wg1.plot_e_field(w, dir='h', alpha=('E', 1, 1))
wg1.plot_e_field(w, dir='h', alpha=('E', 2, 1))
wg1.plot_e_field(w, dir='h', alpha=('E', 3, 1))
wg1.plot_e_field(w, dir='h', alpha=('M', 0, 1))
[14]:
wl = 0.6
w = 2 * np.pi / wl
wg1.plot_h_field(w, dir='v', alpha=('E', 0, 1))
wg1.plot_h_field(w, dir='h', alpha=('E', 1, 1))
wg1.plot_h_field(w, dir='h', alpha=('E', 2, 1))
wg1.plot_h_field(w, dir='h', alpha=('E', 3, 1))
wg1.plot_h_field(w, dir='h', alpha=('M', 0, 1))
[15]:
wl = 0.6
w = 2 * np.pi / wl
wg1.plot_e_field_on_x_axis(w, dir='h', alpha=('E', 1, 1), comp='x')
wg1.plot_h_field_on_x_axis(w, dir='h', alpha=('E', 1, 1), comp='y')